OK.Wahl
Internetpräsentation
Version 2.2.12
Vorläufiges Ergebnis zur Bezirkswahl 2018 am 14.10.2018
Landkreis Augsburg - Stadt Königsbrunn
Es wurden alle Stimmbezirke ausgewertet.
 Diagramm
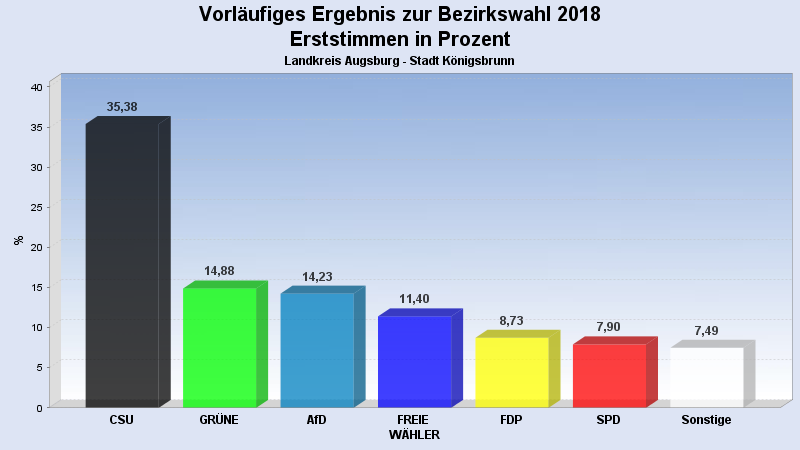
 Seitenanfang
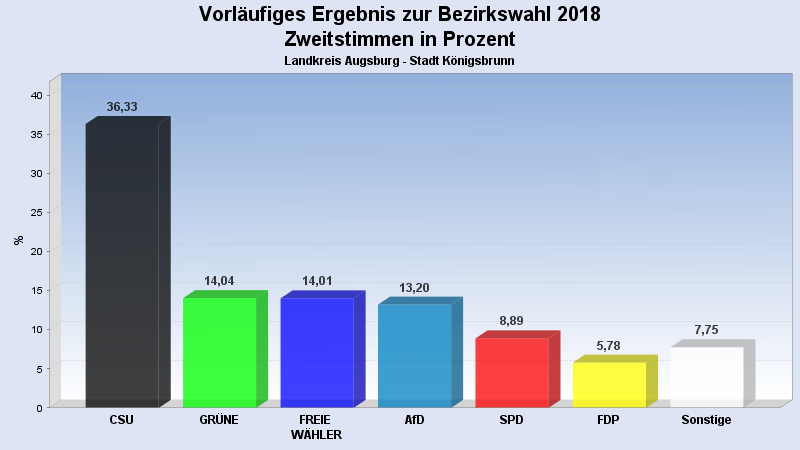
Wahlbeteiligung, Stimmzettel, Stimmen
| Wahlbeteiligung: | 68,94% |
|---|---|
| Stimmberechtigte: | 20.738 |
| Wähler: | 14.296 |
| Ungültige Erststimmen: | 188 |
| Gültige Erststimmen: | 14.108 |
| Ungültige Zweitstimmen: | 244 |
| Gültige Zweitstimmen: | 14.051 |
Erststimmen nach Wahlvorschlag
| Partei | Erststimmen | Prozent | |
|---|---|---|---|
| 1 | Förster, Klaus (CSU) | 4.991 | 35,38% |
| 4 | Probst, Annemarie (GRÜNE) | 2.099 | 14,88% |
| 10 | Skipiol, Frank (AfD) | 2.007 | 14,23% |
| 3 | Naumann, Rainer (FREIE WÄHLER) | 1.608 | 11,40% |
| 5 | Buhl, Manfred (FDP) | 1.232 | 8,73% |
| 2 | Kandler, Hans-Dieter (SPD) | 1.115 | 7,90% |
| 6 | Rupprecht, Anita (DIE LINKE) | 404 | 2,86% |
| 7 | Bernhard, Tobias (BP) | 164 | 1,16% |
| 8 | Müller, Wolfgang (ÖDP) | 159 | 1,13% |
| 12 | Baier, Christian (Die PARTEI) | 129 | 0,91% |
| 13 | Schlipf, Pia (V-Partei³) | 115 | 0,82% |
| 9 | Bachmeir, Wilfried (PIRATEN) | 85 | 0,60% |
Zweitstimmen nach Wahlvorschlag
| Partei | Zweitstimmen | Prozent | |
|---|---|---|---|
| 1 | CSU | 5.105 | 36,33% |
| 4 | GRÜNE | 1.973 | 14,04% |
| 3 | FREIE WÄHLER | 1.968 | 14,01% |
| 10 | AfD | 1.855 | 13,20% |
| 2 | SPD | 1.249 | 8,89% |
| 5 | FDP | 812 | 5,78% |
| 6 | DIE LINKE | 434 | 3,09% |
| 8 | ÖDP | 175 | 1,25% |
| 7 | BP | 167 | 1,19% |
| 12 | Die PARTEI | 140 | 1,00% |
| 13 | V-Partei³ | 103 | 0,73% |
| 9 | PIRATEN | 66 | 0,47% |
| 11 | LKR | 4 | 0,03% |
- Stand: 15.10.2018 07:52:25